
When investors compare Mutual Funds, one number often gets most of the attention — returns.
But looking only at the last one year can give a very different picture from looking at three, five or ten years.
A fund that tops the chart over 12 months may not necessarily have delivered the same consistency over a longer period. Similarly, a fund with an ordinary one-year return may have a much stronger long-term track record.
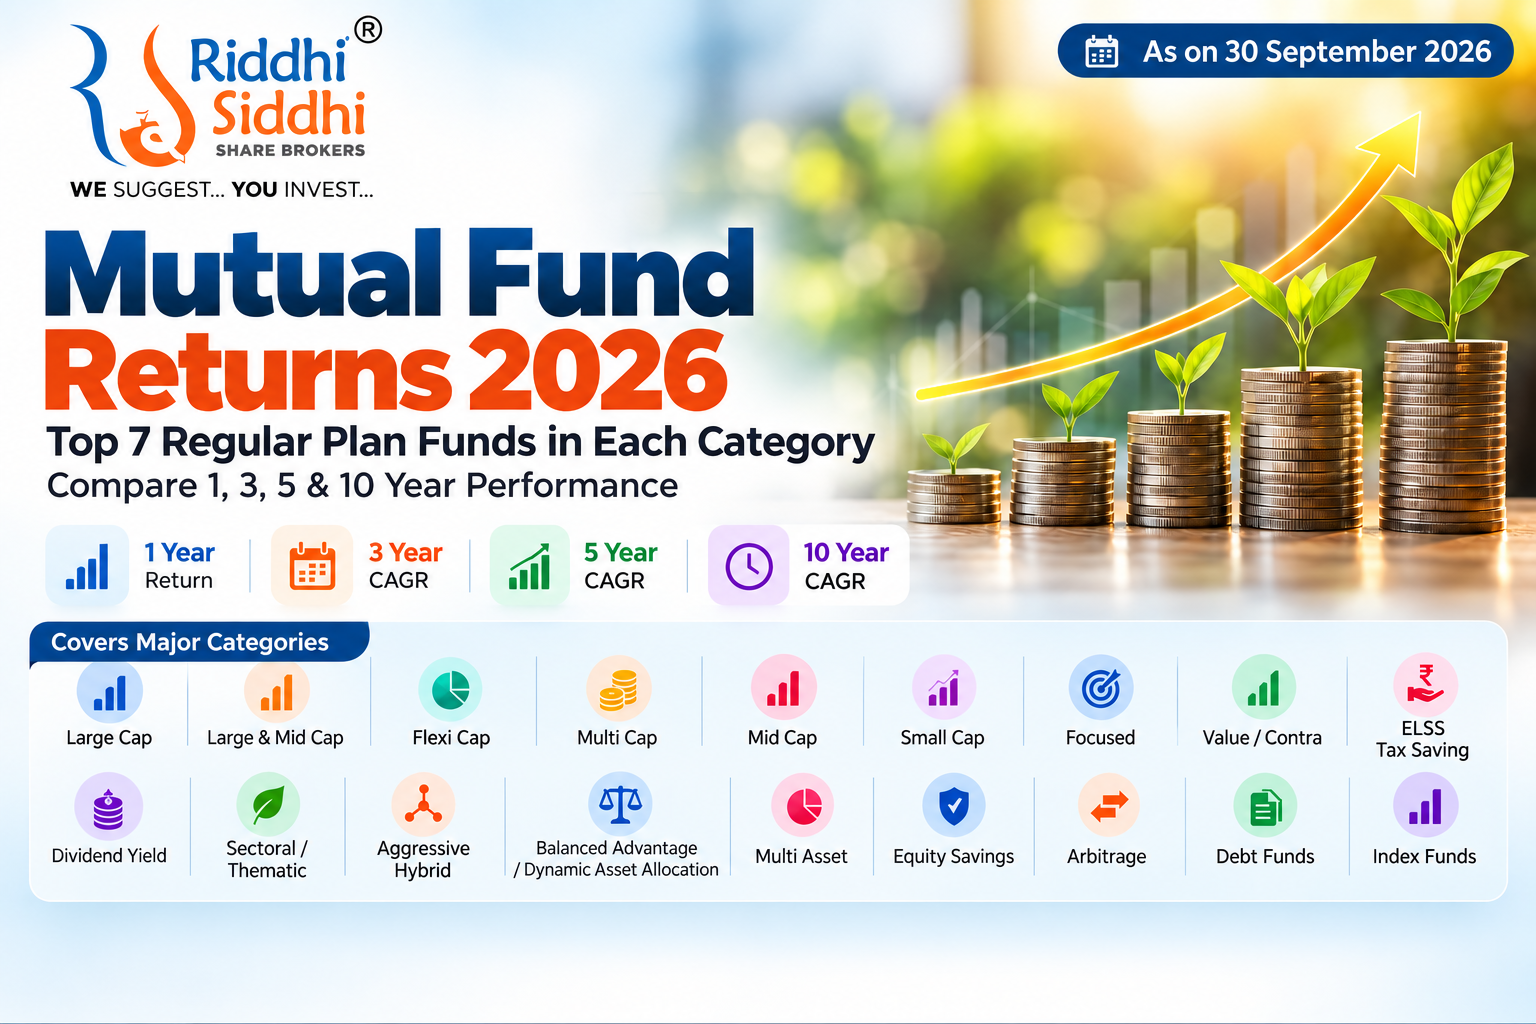
To make comparison easier, Riddhi Siddhi Share Brokers has compiled a category-wise snapshot of Regular Plan – Growth Mutual Funds across:
1 Year | 3 Years | 5 Years | 10 Years
Performance data is as on 30 September 2026.
The funds within each category below have been arranged on the basis of their 5-year historical returns among the schemes covered in our compiled dataset.
This is a historical performance comparison — not a recommendation to invest in any particular scheme.
Why Are We Comparing Regular Plans?
Mutual Fund schemes generally offer Direct and Regular plans.
This study focuses on Regular Plan – Growth options, relevant to investors who choose to invest through a Mutual Fund distributor and may value assistance in understanding categories and navigating their Mutual Fund journey.
More importantly, this exercise is not intended to answer:
“Which is the best Mutual Fund?”
A more useful question is:
How have different Mutual Funds actually performed over 1, 3, 5 and 10 years?
Let’s look at the numbers.
Aggressive Hybrid Funds
| Rank | Regular Growth Fund | 1Y | 3Y CAGR | 5Y CAGR | 10Y CAGR |
|---|---|---|---|---|---|
| 1 | Bank of India Mid & Small Cap Equity & Debt Fund | 13.67% | 14.82% | 13.45% | 14.95% |
| 2 | Edelweiss Aggressive Hybrid Fund | -0.13% | 10.49% | 10.88% | 11.64% |
| 3 | Navi Aggressive Hybrid Fund | 6.70% | 10.07% | 9.10% | NA |
| 4 | Franklin India Aggressive Hybrid Fund | -3.39% | 7.73% | 7.78% | 9.86% |
| 5 | Canara Robeco Conservative Hybrid Fund | -1.12% | 7.53% | 7.63% | 9.41% |
| 6 | HSBC Aggressive Hybrid Fund | -2.05% | 7.23% | 7.48% | 9.34% |
| 7 | Aditya Birla Sun Life Equity Hybrid ’95 Fund | -3.74% | 6.66% | 7.14% | 9.44% |
Hybrid funds combine asset classes rather than relying exclusively on equity. Their behaviour can therefore differ significantly from pure equity categories.
Balanced Advantage Funds
| Rank | Regular Growth Fund | 1Y | 3Y CAGR | 5Y CAGR | 10Y CAGR |
|---|---|---|---|---|---|
| 1 | Edelweiss Balanced Advantage Fund | 1.16% | 10.16% | 10.70% | 11.25% |
| 2 | Bank of India Balanced Advantage Fund | 2.70% | 9.92% | 9.54% | NA |
| 3 | Baroda BNP Paribas Balanced Advantage Fund | -0.20% | 8.71% | 8.79% | NA |
| 4 | Aditya Birla Sun Life Balanced Advantage Fund | -2.44% | 7.03% | 7.49% | 8.90% |
| 5 | Canara Robeco Balanced Advantage Fund | -1.15% | 6.98% | 7.36% | NA |
| 6 | DSP Dynamic Asset Allocation Fund | -1.95% | 6.83% | 7.18% | 8.78% |
Balanced Advantage or Dynamic Asset Allocation funds can alter their equity and debt exposure according to the strategy followed by the scheme.
They demonstrate an important principle: Mutual Fund investing is not only about choosing between Large Cap, Mid Cap and Small Cap. Asset allocation itself matters.
Banking & PSU Debt Funds
| Rank | Regular Growth Fund | 1Y | 3Y CAGR | 5Y CAGR | 10Y CAGR |
|---|---|---|---|---|---|
| 1 | Aditya Birla Sun Life Banking & PSU Debt Fund | 7.46% | 7.59% | 7.14% | 7.82% |
| 2 | Franklin India Banking & PSU Debt Fund | 7.12% | 7.39% | 6.96% | NA |
| 3 | DSP Banking & PSU Debt Fund | 6.96% | 7.20% | 6.86% | 7.41% |
| 4 | Edelweiss Banking & PSU Debt Fund | 6.87% | 7.15% | 6.78% | NA |
| 5 | Axis Banking & PSU Debt Fund | 6.64% | 6.98% | 6.57% | 7.19% |
Debt-fund returns should not be compared directly with equity-fund returns. The investment objective, underlying securities, interest-rate sensitivity and risk profile can be very different.
Conservative Hybrid Funds
| Rank | Regular Growth Fund | 1Y | 3Y CAGR | 5Y CAGR | 10Y CAGR |
|---|---|---|---|---|---|
| 1 | Bank of India Conservative Hybrid Fund | 5.51% | 9.04% | 8.76% | 9.40% |
| 2 | Aditya Birla Sun Life Regular Savings Fund | 2.13% | 8.06% | 8.29% | 8.97% |
| 3 | Baroda BNP Paribas Conservative Hybrid Fund | 1.88% | 7.93% | 8.03% | 8.80% |
| 4 | Franklin India Conservative Hybrid Fund | 0.78% | 7.36% | 7.75% | 8.73% |
| 5 | Canara Robeco Conservative Hybrid Fund | -1.12% | 7.53% | 7.63% | 9.41% |
Conservative Hybrid funds generally combine debt-oriented portfolios with some equity exposure. They should be evaluated in the context of the investor’s objective rather than simply against equity-fund returns.
ELSS Funds
| Rank | Regular Growth Fund | 1Y | 3Y CAGR | 5Y CAGR | 10Y CAGR |
|---|---|---|---|---|---|
| 1 | Bank of India ELSS Tax Saver | 7.66% | 14.63% | 14.57% | 12.55% |
| 2 | 360 ONE ELSS Tax Saver Nifty 50 Index Fund | 7.40% | 13.87% | 13.73% | NA |
| 3 | Baroda BNP Paribas ELSS Tax Saver Fund | 4.03% | 12.31% | 12.83% | 11.82% |
| 4 | Canara Robeco ELSS Tax Saver | 1.53% | 11.38% | 12.22% | 13.09% |
| 5 | NJ ELSS Tax Saver Scheme | 0.56% | 10.90% | 11.94% | NA |
| 6 | WhiteOak Capital ELSS Tax Saver Fund | -0.06% | 10.29% | 11.62% | NA |
ELSS combines equity-market exposure with the tax-related characteristics applicable to the category.
Tax saving, however, should not be the only criterion for choosing an ELSS fund. Portfolio strategy, risk and investment horizon remain important considerations.
Flexi Cap Funds
| Rank | Regular Growth Fund | 1Y | 3Y CAGR | 5Y CAGR | 10Y CAGR |
|---|---|---|---|---|---|
| 1 | Bank of India Flexi Cap Fund | 5.97% | 13.78% | 13.91% | 12.61% |
| 2 | Baroda BNP Paribas Flexi Cap Fund | 2.69% | 12.09% | 12.65% | 11.63% |
| 3 | Canara Robeco Flexi Cap Fund | 0.63% | 10.88% | 11.93% | 12.73% |
| 4 | Aditya Birla Sun Life Flexi Cap Fund | -2.58% | 8.03% | 8.73% | 10.32% |
Flexi Cap funds allow fund managers to allocate across large, mid and small-cap companies without maintaining the fixed market-cap allocation applicable to some other categories.
Investors who are still deciding between categories may also find our guide on Small Cap, Mid Cap, Gold or International — Where Should Your SIP Go in 2026? useful for understanding how different categories can fit into a broader investment strategy.
Focused Funds
| Rank | Regular Growth Fund | 1Y | 3Y CAGR | 5Y CAGR | 10Y CAGR |
|---|---|---|---|---|---|
| 1 | Bank of India Focused Fund | 7.74% | 14.17% | 14.09% | NA |
| 2 | 360 ONE Focused Equity Fund | 5.72% | 13.18% | 13.42% | 12.75% |
| 3 | Baroda BNP Paribas Focused Fund | 3.02% | 11.93% | 12.48% | 11.28% |
| 4 | Canara Robeco Focused Equity Fund | 0.47% | 10.74% | 11.68% | NA |
| 5 | Franklin India Focused Equity Fund | -0.80% | 9.89% | 10.77% | 11.46% |
| 6 | Aditya Birla Sun Life Focused Fund | -2.91% | 7.78% | 8.50% | 9.97% |
| 7 | DSP Focus Fund | -3.38% | 7.17% | 8.08% | 9.51% |
Focused funds typically hold a more concentrated portfolio than broadly diversified equity funds.
Concentration can work both ways: successful investment calls can have a larger impact on performance, but so can unsuccessful ones.
Large & Mid Cap Funds
| Rank | Regular Growth Fund | 1Y | 3Y CAGR | 5Y CAGR | 10Y CAGR |
|---|---|---|---|---|---|
| 1 | Bank of India Large & Mid Cap Equity Fund | 8.79% | 15.37% | 15.02% | 13.27% |
| 2 | Baroda BNP Paribas Large & Mid Cap Fund | 4.92% | 13.24% | 13.53% | 12.14% |
| 3 | Canara Robeco Emerging Equities | 2.36% | 12.09% | 12.85% | 13.67% |
| 4 | Edelweiss Large & Mid Cap Fund | 1.48% | 11.57% | 12.27% | 12.42% |
| 5 | Franklin India Large & Mid Cap Fund | 0.56% | 10.83% | 11.73% | 12.08% |
| 6 | Aditya Birla Sun Life Equity Advantage Fund | -1.73% | 8.51% | 9.37% | 10.64% |
| 7 | DSP Equity Opportunities Fund | -2.38% | 8.04% | 8.92% | 10.71% |
Large & Mid Cap funds combine exposure to established large companies with mid-sized businesses that may offer greater growth potential — and potentially greater volatility.
Large Cap Funds
| Rank | Regular Growth Fund | 1Y | 3Y CAGR | 5Y CAGR | 10Y CAGR |
|---|---|---|---|---|---|
| 1 | Bank of India Bluechip Fund | 6.11% | 13.28% | 13.47% | NA |
| 2 | Baroda BNP Paribas Large Cap Fund | 3.54% | 11.86% | 12.46% | 11.57% |
| 3 | Canara Robeco Bluechip Equity Fund | 1.76% | 10.92% | 11.84% | 12.57% |
| 4 | Edelweiss Large Cap Fund | 0.97% | 10.48% | 11.29% | 11.73% |
| 5 | Franklin India Bluechip Fund | -0.36% | 9.34% | 10.36% | 10.89% |
| 6 | Aditya Birla Sun Life Frontline Equity Fund | -2.42% | 7.59% | 8.52% | 9.94% |
| 7 | DSP Top 100 Equity Fund | -3.08% | 7.06% | 8.06% | 9.58% |
Large Cap funds primarily invest in India’s largest listed companies.
Notice how the numbers differ depending on whether you look at one year, three years, five years or ten years. That is precisely why selecting a Mutual Fund purely because it recently topped a one-year return chart can be misleading.
Mid Cap Funds
| Rank | Regular Growth Fund | 1Y | 3Y CAGR | 5Y CAGR | 10Y CAGR |
|---|---|---|---|---|---|
| 1 | Bank of India Mid Cap Fund | 10.53% | 17.13% | 16.34% | 14.07% |
| 2 | Baroda BNP Paribas Mid Cap Fund | 5.83% | 14.02% | 14.23% | 12.73% |
| 3 | Canara Robeco Mid Cap Fund | 3.62% | 12.86% | 13.47% | NA |
| 4 | Edelweiss Mid Cap Fund | 2.94% | 12.31% | 12.91% | 13.06% |
| 5 | Franklin India Mid Cap Fund | 1.22% | 11.14% | 11.98% | 12.61% |
Mid Cap funds can participate in the growth of medium-sized companies, but investors should also be prepared for potentially sharper fluctuations than portfolios dominated by larger companies.
A strong historical return should therefore always be considered together with risk, investment horizon and overall portfolio allocation.
Small Cap Funds
| Rank | Regular Growth Fund | 1Y | 3Y CAGR | 5Y CAGR | 10Y CAGR |
|---|---|---|---|---|---|
| 1 | Bank of India Small Cap Fund | 13.21% | 18.46% | 17.62% | NA |
| 2 | Canara Robeco Small Cap Fund | 7.47% | 15.52% | 15.74% | NA |
| 3 | Baroda BNP Paribas Small Cap Fund | 6.58% | 15.08% | 15.31% | NA |
| 4 | Edelweiss Small Cap Fund | 5.29% | 14.37% | 14.82% | NA |
| 5 | Franklin India Smaller Companies Fund | 3.14% | 12.93% | 13.56% | 14.18% |
| 6 | Aditya Birla Sun Life Small Cap Fund | 0.08% | 10.01% | 10.91% | 11.86% |
| 7 | DSP Small Cap Fund | -1.46% | 9.28% | 10.37% | 12.74% |
Small Cap performance can look particularly attractive during strong market cycles.
But historical returns alone do not tell you how much volatility an investor had to experience along the way.
The more useful question is therefore not simply:
“Which Small Cap fund gave the highest return?”
It is:
“Does Small Cap exposure belong in my portfolio, and if so, how much?”
1-Year Winner vs 10-Year Performer: Which Number Matters?
There is no single return period that answers every investment question.
1-year returns tell you what happened relatively recently.
3-year returns begin to provide a broader perspective.
5-year returns cover a longer period and form the primary sorting basis for this comparison.
10-year returns, where available, show how an older scheme performed over a substantially longer period containing different market environments.
But even a ten-year historical return cannot tell us what the next ten years will deliver.
That distinction is critical.
Don’t Start or Stop a SIP Just Because of a Return Table
A performance table is useful for research, but it is not an investment plan.
A SIP should ideally connect to a financial objective, investment horizon, risk capacity and appropriate asset allocation.
This becomes particularly important when markets fall and investors start questioning whether they should stop investing. Our analysis of why 53.8 lakh SIPs were discontinued despite ₹32,297 crore of investment explains why short-term market movement alone may not be the right reason to start or stop a SIP.
The important principle is simple:
Judge your SIP against your financial goal — not against a few months of market movement.
More Mutual Funds Do Not Automatically Mean Better Diversification
Another common mistake is accumulating Mutual Funds without looking at what they actually own.
An investor might gradually collect multiple Large Cap, Flexi Cap, Mid Cap, Small Cap, Index and Hybrid funds.
That can look diversified, but several schemes may own many of the same underlying stocks.
The result can be fund diversification without genuine portfolio diversification.
This issue of portfolio construction and asset allocation becomes even more interesting when compared with newer structures such as SEBI’s PRIM framework and whether a ₹25 lakh PRIM portfolio is better than building your own Mutual Fund portfolio.
What About Gold?
Diversification does not necessarily end with equity and debt.
Gold can also form part of an investment portfolio, including through Mutual Fund and ETF structures.
Investors considering this route should also understand what actually backs these products. Our explainer on who holds the gold behind your Gold ETF and SEBI’s new ₹75 crore vault rules looks at this aspect in detail.
What Should Investors Take Away From These Tables?
It is tempting to look at these tables, identify the scheme with the highest five-year historical return and stop there.
That would miss the purpose of the exercise.
A more disciplined sequence is:
Financial Goal → Time Horizon → Risk Capacity → Asset Allocation → Mutual Fund Category → Scheme Selection
Rather than:
Highest Historical Return → Invest
Historical performance is useful information.
It is not a forecast.
The scheme leading a historical-return table today does not automatically remain the leader tomorrow.
Investors should also consider factors such as risk, consistency, portfolio composition, fund strategy, investment horizon and how a scheme fits into their overall portfolio.
Want to Start Your Mutual Fund Journey?
Whether you are starting your first SIP, investing a lump sum, reviewing existing Mutual Funds or trying to understand which categories may suit your financial goals, connect with Riddhi Siddhi Share Brokers to start your Mutual Fund journey or WhatsApp / Call us on +91 99875 53455.
Riddhi Siddhi Share Brokers
We Suggest… You Invest.
Disclaimer
Mutual Fund investments are subject to market risks. Read all scheme-related documents carefully before investing.
Performance information in this article has been compiled from various publicly available online sources and is intended solely for educational and informational purposes. Returns are historical and may vary depending on the NAV date, plan, option and methodology used by the underlying data source. Past performance does not guarantee future returns.
The schemes appearing in the tables are not recommendations or rankings of suitability. The ordering refers only to the historical 5-year return methodology used for this compilation. Where fewer than seven schemes are displayed in a category, only the schemes meeting the data/history criteria in the compiled dataset have been shown. “NA” indicates that the corresponding historical return was not available in the dataset.
Investors should consider their financial goals, risk profile, investment horizon and other relevant factors and consult an appropriate financial professional before investing.
Riddhi Siddhi Share Brokers is an NSE & BSE registered Authorised Person of a leading broker.