

Indian Stock Market Surges: Nifty Gains 159 Points as Bulls Return After Trump’s Japan Trade Deal
Published: July 23, 2025 | Market Close Analysis The Indian stock market witnessed a remarkable comeback today,[…]

Indian Stock Market Analysis: Week of July 21-25, 2025 – Q1 Earnings Season in Full Swing
The Indian stock market enters a crucial week as Q1 earnings season hits its stride, with major[…]

Indian Stock Market Analysis: Nifty Slides Below 25,000 as Tariff Concerns Weigh Heavy (July 18, 2025)
Market Overview: A Week of Volatility Ends on Cautious Note The Indian stock market concluded Friday, July[…]
Indian Stock Market Update: Nifty Gains Amid Fed Rate Concerns and Trump Tariff Threats – July 16, 2025
Market Overview: Mixed Signals Despite Positive Close The Indian stock market displayed resilience on Wednesday, July 16th,[…]
Indian Stock Market Analysis: Nifty Falls for Fourth Consecutive Day Amid Trump Tariff Concerns | July 14, 2025
Published: Monday, July 14, 2025 Market Summary: Bears Maintain Control as Nifty Struggles Below 25,100 The Indian[…]

Indian Stock Market Outlook: Navigating Trump’s Tariff Threats and Q1 Earnings Season
Published: July 13, 2025 The Indian stock market faces a crucial week ahead as global trade tensions[…]

Indian Stock Market Update: Nifty Faces Headwinds as US-India Trade Tensions Weigh on Investor Sentiment
Market Analysis for July 10, 2025 The Indian equity markets faced a challenging trading session on Thursday,[…]

Indian Stock Market Closes Higher on US-India Trade Deal Optimism – July 8, 2025 Analysis
Indian Equities International markets provided additional momentum to Indian stocks: Japanese Nikkei 225: +0.26% Market Overview: Nifty[…]

The Week Ahead – Riddhi Siddhi Share Brokers Market Outlook | Sunday, April 13th, 2025
Positive Bias Expected in a Truncated Trading Week Riddhi Siddhi Share Brokers Outlook: Cautious Optimism Amid Reduced[…]
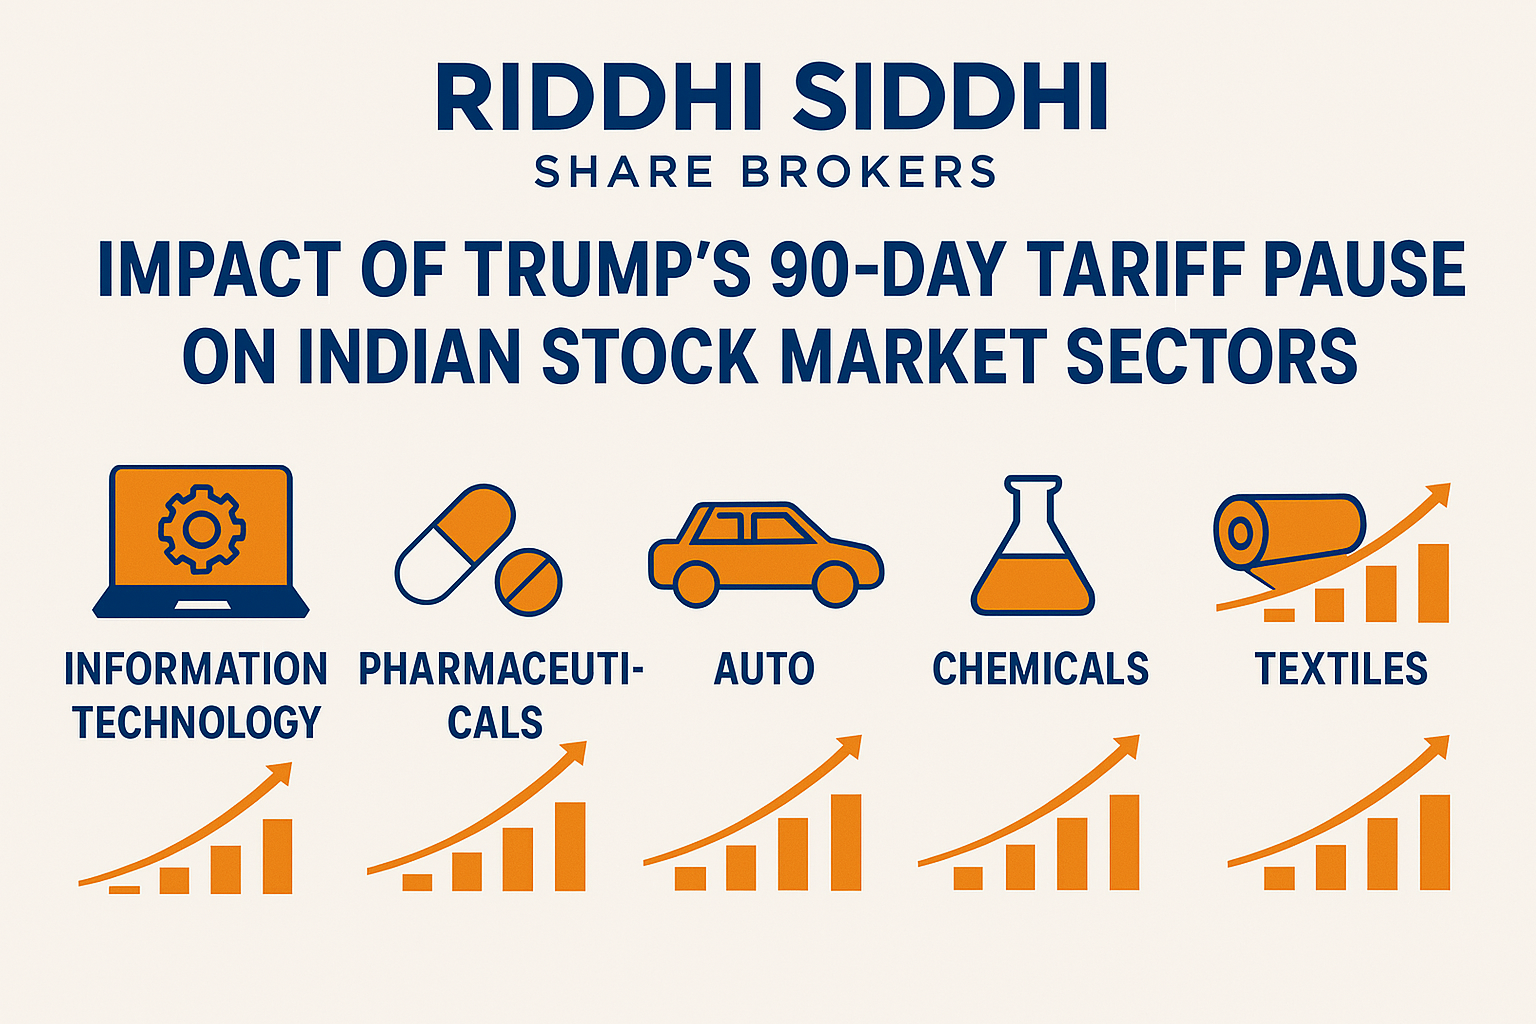
Trump’s 90-Day Tariff Pause: Impact on Indian Stock Market Sectors
Donald Trump’s announcement of a 90-day pause on tariffs amid the U.S.-China trade war has sent a[…]