
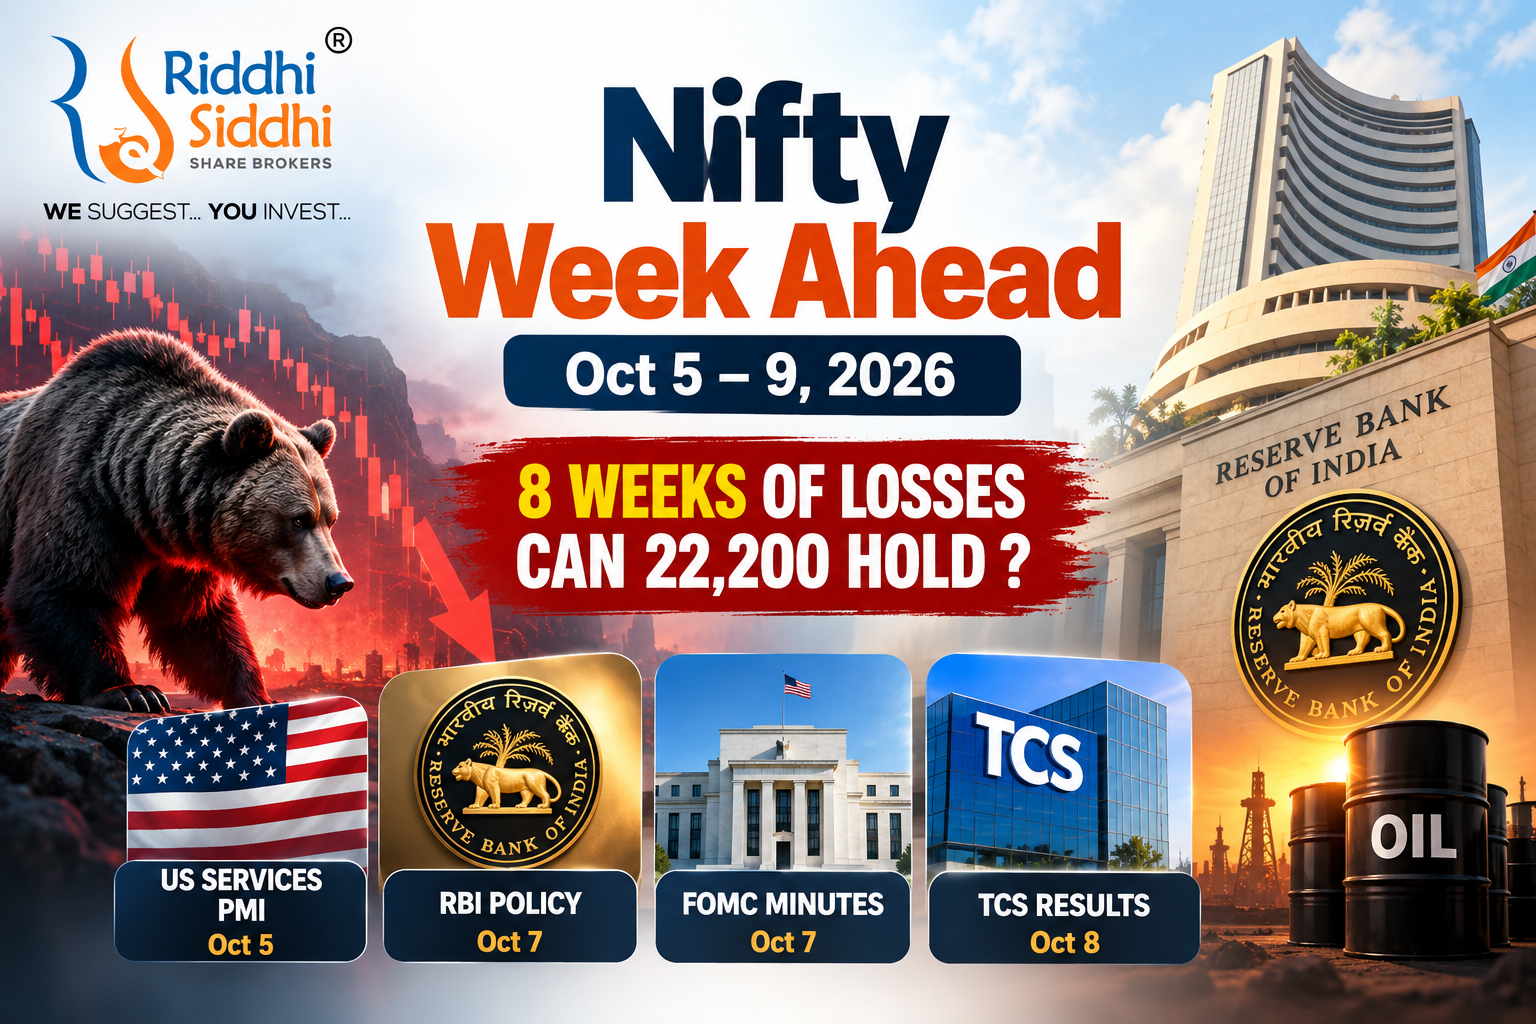
Riddhi Siddhi Share Brokers — The Week Ahead | October 5–9, 2026
Eight weeks.
Eight consecutive weekly declines.
The Nifty 50 enters the week of October 5–9 after completing its longest continuous weekly losing streak in 25 years.
Nifty closed the holiday-shortened previous week at 22,421.95, falling 718.55 points or 3.11%, while the Sensex ended at 71,909.70, down 2.69%.
Across eight consecutive losing weeks, Nifty has now fallen approximately 8.7%.
But the coming week could prove even more important.
The Reserve Bank of India delivers its monetary-policy decision on Wednesday, October 7. US Federal Reserve minutes arrive later the same day. TCS begins the large-cap IT earnings season on Thursday, October 8.
And all of this comes while crude oil remains elevated, US Treasury yields remain unusually high, the rupee is under pressure, foreign investors continue selling Indian equities and geopolitical tensions across the Middle East are showing little sign of disappearing.
For Dalal Street, therefore, the biggest question is straightforward:
Can 22,200 finally stop the eight-week Nifty decline — or are we heading towards a ninth consecutive losing week?
Readers who followed our previous Week Ahead analysis for September 28–October 2 will remember that 23,000 was the key battlefield.
It did not hold.
We subsequently explained what that breakdown meant in our analysis of Nifty below 23,000 and the levels investors and traders should watch.
The market has now moved to its next major test.
NIFTY WEEK AHEAD OCT 5–9 | KEY LEVELS
| Market Level | Zone |
|---|---|
| Previous Close | 22,421.95 |
| Immediate Support | 22,330–22,200 |
| Major Breakdown Zone | Below 22,180 |
| Immediate Resistance | 22,700–22,800 |
| Psychological Resistance | 23,000 |
| Initial Recovery Confirmation | Above 23,070 |
| 20-Day EMA Hurdle | Around 23,220 |
The technical structure remains bearish.
Nifty continues to form lower highs and lower lows and remains below important short-term moving averages.
The first requirement for bulls is therefore not a dramatic new high.
It is simply to stop making new lows.
The 22,200 region becomes particularly important for that reason.
THE BIG QUESTION | CAN NIFTY FIND ITS FOOTING?
Indian equities have rarely entered a trading week with such an unusual combination of pressures.
Consider what the market is simultaneously dealing with:
- Eight consecutive weekly declines
- Persistent FII selling
- Crude oil around elevated levels
- A weaker rupee
- US Treasury yields near multi-decade highs
- Possibility of renewed RBI tightening
- Continuing US–Iran tensions
- Escalating Saudi–Houthi hostilities
- Beginning of India’s Q2 FY27 earnings season
This is why simply arguing that “the market has fallen enough” is not a sufficient investment or trading thesis.
Markets can certainly produce sharp relief rallies after prolonged declines.
But a relief rally and a trend reversal are not necessarily the same thing.
THE GOOD NEWS | WHY NIFTY BULLS SHOULD NOT GIVE UP YET
The picture is bearish — but it is not completely one-sided.
The latest US employment report showed payroll growth substantially below expectations, reducing some of the immediate pressure for another Federal Reserve rate increase.
That helped cool expectations for near-term US tightening.
Technology stocks in the US have also remained relatively resilient, while Indian IT was the only major domestic sector to finish the previous week in positive territory.
There is another important factor.
After eight consecutive losing weeks, positioning has become considerably more defensive.
That means even modest positive surprises — softer crude, falling US yields, a less-hawkish RBI outcome, easing geopolitical tensions or slowing FII selling — could trigger a sharp short-covering or relief rally.
But bulls still need price confirmation.
WEEK AHEAD | 5 BIG THINGS TO WATCH
| Trigger | Date / Status | Why It Matters |
|---|---|---|
| US ISM Services PMI | Oct 5 | Growth, employment and inflation signals |
| RBI MPC Decision | Oct 7 | Rates, inflation, liquidity and rupee |
| US FOMC Minutes | Oct 7 | Fed’s internal debate on rates |
| TCS Q2 FY27 Results | Oct 8 | Beginning of large-cap IT earnings |
| Crude + Geopolitics + FII Flows | Daily | Major drivers of Indian risk sentiment |
Let us examine them individually.
1. RBI POLICY | THE BIGGEST DOMESTIC EVENT OF THE WEEK
The RBI Monetary Policy Committee meets from October 5 to October 7, with the policy decision scheduled for Wednesday.
The repo rate currently stands at 5.25%.
A majority of economists surveyed ahead of the meeting expect the RBI to raise the repo rate by 25 basis points to 5.50%, although that remains a forecast — not a certainty.
Why has the possibility of a rate hike returned?
The answer lies in the combination of:
Higher crude oil + broader inflation pressures + resilient domestic growth + weaker rupee + tighter global financial conditions.
For equity markets, however, the policy statement could matter as much as the rate decision itself.
Investors should watch:
Inflation outlook
Has the RBI become more concerned about energy-led inflation?
Growth outlook
Does the central bank still see sufficient economic resilience to absorb tighter monetary conditions?
Liquidity
Will banking-system liquidity become tighter?
Future guidance
Would a hike represent a one-off response or potentially the beginning of a new tightening phase?
Riddhi Siddhi Share Brokers recently explained how RBI liquidity operations can flow through from banking liquidity to overnight rates, bond yields, funding conditions and eventually financial markets in our analysis of the RBI’s liquidity withdrawal and its impact on rates, bonds and stocks.
That transmission mechanism becomes even more important this week.
WHAT COULD AN RBI RATE HIKE MEAN FOR BANK NIFTY?
The impact is not automatically negative for every bank.
Floating-rate loans may reprice faster than deposits initially, potentially helping some lenders.
But over time, higher deposit costs can reduce that benefit.
NBFCs can face a different challenge because many depend more heavily on bank borrowings and market funding.
Higher borrowing costs can therefore place pressure on margins.
This makes the RBI’s commentary on liquidity and the future rate path especially important for financial stocks.
2. FOMC MINUTES | WHAT IS THE FED REALLY THINKING?
The US Federal Reserve releases minutes from its September 15–16 meeting on Wednesday, October 7.
Markets will look beyond the headline policy decision and examine how strongly policymakers debated inflation risks, labour-market weakness and the possibility of further tightening.
The latest softer US employment data has reduced immediate rate-hike fears.
But one weak economic report does not settle the debate.
For India, the transmission channel is important:
Fed expectations → US Treasury yields → Dollar → FII flows → Rupee → Indian equities
That is why movements in US bond yields can sometimes matter almost as much to Dalal Street as domestic economic data.
3. US SERVICES PMI | MONDAY’S FIRST GLOBAL TEST
The US ISM Services PMI for September is scheduled for Monday, October 5.
This deserves attention because services represent the dominant part of the US economy.
The previous Services PMI showed continued expansion, but price pressures remained elevated while employment was comparatively weak.
Markets will therefore examine three components particularly closely:
Business activity
Employment
Prices paid
A combination of slowing activity and cooling prices could reduce pressure on the Fed.
Strong activity accompanied by stubborn inflation could have the opposite effect.
4. TCS RESULTS | INDIA’S Q2 EARNINGS SEASON BEGINS
TCS reports its September-quarter results on Thursday, October 8, effectively beginning the major Indian IT earnings season.
The timing is particularly interesting.
IT was the only major sector to gain during the previous week’s broad market decline.
But the fundamental backdrop remains challenging.
Investors will closely monitor:
- Constant-currency revenue growth
- Operating margins
- Large deal wins
- Discretionary technology spending
- Client budgets
- Management guidance
- AI-related demand
- Whether AI is expanding opportunities or creating pricing pressure
The weaker rupee can provide a currency tailwind for exporters.
But currency cannot permanently compensate for weak client spending.
TCS therefore becomes more than one company’s quarterly result.
It becomes the market’s first major read-through for the entire Indian IT sector.
5. MIDDLE EAST | THE RISK PREMIUM HAS NOT DISAPPEARED
The US–Iran conflict remains one of the biggest external risks facing global markets.
And over the weekend, another front became increasingly important.
Yemen’s Iran-aligned Houthis said they targeted an Aramco facility near Riyadh with ballistic missiles and drones.
Smoke and fire were reported near the facility, although Saudi authorities and Aramco had not immediately confirmed the Houthi account.
This followed earlier Houthi claims of attacks on Aramco facilities around Yanbu. Saudi Arabia said it intercepted six ballistic missiles headed towards the Taif and Yanbu areas and did not report damage to Aramco facilities.
Saudi–Houthi hostilities therefore represent an additional risk layer on top of the continuing US–Iran confrontation.
For financial markets, the concern is straightforward:
Energy infrastructure is increasingly exposed to geopolitical risk.
OIL | OPEC+ OFFERS SOME RELIEF — BUT NOT ENOUGH TO REMOVE THE RISK
There is an important development this Sunday.
OPEC+ has agreed in principle to keep November oil-production targets unchanged.
Ordinarily, stable production targets could help calm markets.
But these are not ordinary circumstances.
Gulf oil exports continue to face disruption from the regional conflict, and actual production and exports can matter considerably more than announced quotas when infrastructure and shipping routes are under pressure.
The Strait of Hormuz remains particularly important.
For India, persistently high crude affects several variables simultaneously:
Inflation → Rupee → Current Account → Corporate Margins → RBI Policy → Equity Valuations
That makes crude one of the most important numbers on the screen this week.
FOREIGN INVESTORS | ₹34,966 CRORE SOLD IN JUST FOUR SESSIONS
One number illustrates the scale of pressure facing Indian equities.
During the September 28–October 1 trading week:
FIIs sold approximately ₹34,966 crore of Indian equities.
Domestic institutional investors bought approximately:
₹33,455 crore.
Domestic institutions therefore absorbed most of the foreign selling.
For September overall, FII selling was approximately ₹44,012 crore, while domestic institutions remained substantial net buyers.
This creates one of the clearest battles currently visible in Indian equities:
FII SELLING vs DII BUYING
For a durable market recovery, Riddhi Siddhi Share Brokers would like to see at least a meaningful slowdown in foreign selling.
ONE NUMBER THAT SHOWS HOW WEAK MARKET BREADTH HAS BECOME
As of October 1:
Only around 8% of Nifty 50 stocks were trading above their 50-day moving average.
That is an unusually weak breadth reading.
It tells us the correction is not merely being driven by one or two heavyweight stocks.
Weakness has spread across much of the index.
Extremely weak breadth can sometimes precede a rebound.
But it does not, by itself, prove that a bottom has formed.
A healthier recovery would involve both:
Nifty moving higher + more constituent stocks reclaiming their 50-day averages.
NIFTY TECHNICAL OUTLOOK | CAN 22,200 HOLD?
Nifty CMP: 22,421.95
The technical trend remains negative.
The index remains below important short-term moving averages, and the sequence of lower highs and lower lows has not yet been broken.
Immediate Support
22,330–22,200
Major Breakdown Zone
22,180
A decisive close below this region could expose:
22,000 → 21,800 → potentially lower levels if selling accelerates.
Immediate Resistance
22,700–22,800
Major Psychological Resistance
23,000
Recovery Confirmation
A sustained close above approximately 23,070 would provide the first meaningful indication that the immediate price structure is improving.
The falling 20-day EMA around the 23,200–23,250 region would then become the next hurdle.
In other words:
22,200 is the bulls’ defence line.
23,000–23,070 is the bears’ defence line.
The battle between those two zones could define the week.
RIDDHI SIDDHI SHARE BROKERS | PRICE FORECAST
NIFTY 50
CMP: 22,422
Support: 22,200 / 21,800
Resistance: 22,800 / 23,000
Broad Expected Zone: 21,800–23,000
Bias: Negative until recovery is confirmed
BANK NIFTY
CMP: 54,451
Immediate Support: 54,000–53,800
Major Support: Around 52,700
Immediate Resistance: 54,900–55,200
Major Resistance: 55,500–55,600
Bias: Cautious / Negative
NIFTY OPTIONS | WHAT DERIVATIVES TRADERS SHOULD WATCH
Options positioning continues to indicate substantial resistance around the 23,000–23,500 region, while lower strikes around the 22,000–22,200 area remain important for support development.
But traders should remember something particularly important during an event-heavy week.
Open interest can change very quickly around:
- RBI policy
- FOMC minutes
- Crude-oil moves
- Geopolitical headlines
- Large overnight global-market moves
Options positioning should therefore be treated as a dynamic market indicator rather than a guaranteed trading range.
Anyone trading leveraged derivatives should also understand the broader statistics around retail F&O participation.
Our detailed analysis of SEBI’s FY25–FY26 data found that nearly 88% of individual F&O traders lost money.
That lesson becomes particularly relevant in weeks where several major event risks can move markets abruptly.
RIDDHI SIDDHI’S PREFERRED NIFTY VIEW FOR THE WEEK
Nifty: 22,422
View: Bearish below major recovery levels
Initial Downside Reference: 22,200–22,110
Next Downside Zone: 21,800–21,740
Aggressive Downside Scenario: Around 21,450 if support fails decisively
Bearish View Invalidates / Weakens: Above approximately 22,800 initially, with stronger confirmation above 23,000–23,070
These are market-analysis reference levels, not guaranteed outcomes or personalised trading recommendations.
Given the number of event risks this week, traders should avoid treating any level as infallible.
SECTOR OUTLOOK | WHERE RELATIVE STRENGTH IS EMERGING
Relatively Stronger
IT
IT was the only major sector to finish the previous week higher.
The weaker rupee offers support, although TCS results will now test whether price strength is supported by business fundamentals.
Private Banks
Private banks outperformed the broader market on a relative basis despite finishing lower.
The RBI decision will determine whether that relative strength can continue.
Pharma / Healthcare
Pharma remains an interesting defensive area in a market where global risk remains elevated.
SECTORS FACING GREATER PRESSURE
Realty
Higher interest-rate expectations can create an additional valuation and demand headwind.
Automobiles
The sector suffered significant selling during the previous week.
Consumer / FMCG
Demand concerns and inflation risks remain important.
Energy-Sensitive Businesses
Companies vulnerable to higher fuel, freight or input costs need particularly close monitoring while crude remains elevated.
Infrastructure
Higher borrowing costs and broader risk aversion could remain headwinds for highly valued names.
STOCKS IN FOCUS | OCTOBER 5–9
Relatively Bullish / Stronger Setups to Monitor
INFY | RBLBANK | NYKAA | MAHABANK
Stocks Showing Greater Technical Vulnerability
PBFINTECH | APLAPOLLO | BSE | JUBLFOOD | BRITANNIA | TATACONSUM | SBIN | MAZDOCK | GRASIM | BAJFINANCE | FORCEMOT
These are market-watch observations based on prevailing price structure and should not be interpreted as blanket buy or sell recommendations.
RIDDHI SIDDHI SHARE BROKERS STOCK OF THE WEEK
IPCA LABORATORIES | EARNINGS MOMENTUM MEETS A CRITICAL BREAKOUT ZONE
IPCA LAB CMP: ₹1,943.20
Ipca Laboratories enters the week with an interesting combination of improving earnings, stronger margins, growing exports and a share price trading close to an important technical breakout region.
The company operates across:
- Indian branded formulations
- International formulations
- Active pharmaceutical ingredients
- Chronic therapies
- Acute therapies
- International operations through Unichem
Its domestic portfolio spans therapeutic areas including pain management, cardiovascular disease, diabetes and dermatology.
But what makes IPCA particularly interesting today is the acceleration visible in its latest quarterly numbers.
IPCA Q1 FY27 | STRONG EARNINGS ACCELERATION
For the quarter ended June 30, 2026:
| Metric | Q1 FY27 | YoY Change |
|---|---|---|
| Revenue from Operations | ₹2,788.10 crore | +20.76% |
| Consolidated Profit | Above ₹400 crore | Strong growth |
| Management-Reported EBITDA | ~₹638 crore | Around +50% |
| EBITDA Margin | 22.88% | Significant expansion |
The quarter demonstrated more than revenue growth.
Operating leverage improved materially.
WHAT IS DRIVING IPCA’S GROWTH?
1. Domestic Formulations
Domestic formulation revenue reached approximately ₹1,082 crore, growing around 13%.
More importantly, chronic therapies grew faster than acute therapies.
Chronic treatments generally involve recurring medication requirements, which can create a comparatively more stable demand base.
2. Export Formulations
Export formulations increased approximately 34% to ₹603 crore.
That is encouraging.
However, investors should not extrapolate the entire quarterly growth rate mechanically.
Part of institutional-sales growth reflected shipments that had been deferred from March into April.
The next few quarters therefore need to confirm the underlying run rate.
3. Unichem Integration
Unichem gives IPCA additional international distribution capabilities.
Management commentary indicated strong growth in IPCA products distributed through Unichem, while Unichem’s own portfolio grew more moderately.
The investment case therefore partly depends on IPCA successfully converting this distribution platform into sustainable sales and earnings growth.
4. API Integration
IPCA manufactures both finished formulations and active pharmaceutical ingredients.
Greater internal API capability can potentially support:
- Supply reliability
- Cost competitiveness
- Product development
- Export growth
- Customer relationships
Execution remains the key.
IPCA FY27 OUTLOOK | MANAGEMENT HAS BECOME MORE CONFIDENT
Following the strong first quarter, management increased its consolidated FY27 revenue-growth expectation to approximately 14%–16% from the earlier 12%–13% range.
The company also indicated an FY27 consolidated EBITDA-margin objective around:
23%
Longer term, management has discussed the possibility of margins moving towards approximately 25%–26% over the next two to three years.
Those are management objectives — not guaranteed outcomes.
But the direction is encouraging.
IPCA | THE RISKS INVESTORS SHOULD NOT IGNORE
Shipment Timing
Part of Q1 benefited from deliveries carried forward from the previous quarter.
Freight & Logistics
Regional conflict and shipping disruptions can increase freight costs and delivery times.
Regulatory Risk
Pharmaceutical exports depend heavily on manufacturing quality, approvals and continuing regulatory compliance.
Unichem Execution
The strategic logic of the acquisition needs to translate into sustained earnings.
Valuation
At approximately ₹1,943, the market is already recognising part of the improving business outlook.
Good businesses can still deliver poor investment returns if purchased at excessive valuations.
IPCA | PRICE LEVELS TO WATCH
| Zone | Significance |
|---|---|
| ₹1,880–₹1,900 | Immediate support / recent low region |
| ₹1,970–₹2,000 | Near-term hurdle |
| ₹2,038–₹2,040 | Important recent high / breakout area |
| Above ₹2,040 | Could strengthen the longer-term price structure |
A sustained move through ₹2,000 followed by a decisive breakout above approximately ₹2,038 would strengthen the technical structure.
RIDDHI SIDDHI SHARE BROKERS | IPCA PREFERRED STRATEGY
Stock: IPCA LABORATORIES
CMP: ₹1,943
View: BUY / ACCUMULATE ON MEANINGFUL DECLINES
Accumulation Zone: ₹1,750–₹1,800 on deeper market-led corrections
Immediate Technical Objective: ₹2,038–₹2,040
Aggressive Longer-Term Reference: ₹2,300 region, subject to earnings delivery and breakout confirmation
Risk Reference / Stop: ₹1,687
Risk Level: Moderate–High
Indicative Holding Period: 9–12 months
The investment thesis depends on earnings growth, export momentum, Unichem execution and margin improvement continuing beyond the unusually strong first quarter.
THE BULL CASE FOR THE WEEK
A meaningful Nifty rebound becomes more credible if several things happen together:
Crude cools
US Treasury yields retreat
RBI is less hawkish than feared
FII selling slows
Rupee stabilises
Nifty holds 22,200
Nifty subsequently reclaims 22,800 and 23,000
If these conditions begin aligning, the eight-week decline could finally give way to a broader relief rally.
THE BEAR CASE
The downside scenario becomes more dangerous if:
Crude rises sharply again
Middle East hostilities escalate
RBI delivers a hawkish hike
US yields resume climbing
FII selling accelerates
and most importantly:
Nifty decisively breaks 22,180–22,200.
In that scenario, 22,000 could be tested quickly, followed by the 21,800 region.
RIDDHI SIDDHI’S GYAN MANTRA
Don’t buy merely because the market has fallen. Buy when risk and opportunity make sense together.
Eight consecutive losing weeks naturally create temptation to call the bottom.
But markets do not reverse because a losing streak looks unusually long.
They reverse when the balance between buyers and sellers changes.
That change ultimately appears in price.
Stay selective.
Keep leverage under control.
Respect risk.
And allow price action to confirm the recovery.
RIDDHI SIDDHI WEEK AHEAD | THE BOTTOM LINE
October 5–9 could become one of the most important trading weeks of the current correction.
Nifty enters the week after:
8 CONSECUTIVE WEEKLY LOSSES — THE LONGEST SUCH STREAK IN 25 YEARS.
The market now faces:
RBI POLICY | FOMC MINUTES | US SERVICES PMI | TCS RESULTS | CRUDE OIL | US–IRAN WAR | SAUDI–HOUTHI ESCALATION | FII SELLING
There is certainly room for a relief rally.
But Riddhi Siddhi Share Brokers would prefer to see evidence rather than anticipation.
For the coming week:
22,200 is the key downside battlefield.
23,000–23,070 is the key recovery battlefield.
Until the latter is reclaimed convincingly, the broader technical bias remains cautious to negative.
Need Help Executing Your Market Strategy?
Volatile markets can make execution, position sizing and trading discipline considerably more important.
Investors and traders who require structured Trade Execution Support can explore Riddhi Siddhi Share Brokers’ Assisted Trading Services.
Riddhi Siddhi Share Brokers
We Suggest… You Invest.
NSE & BSE registered Authorised Person of a leading broker.
Disclaimer
This article is published by Riddhi Siddhi Share Brokers for educational, learning and informational purposes only. Market views, technical levels, sector observations, stocks in focus and trading or investment scenarios discussed above do not constitute personalised investment advice or any assurance of returns.
Stock-market investments and derivatives trading are subject to market risk. Futures and options involve leverage and can result in substantial losses. Historical performance, technical patterns, management guidance and past financial results do not guarantee future performance.
Readers should independently evaluate their financial objectives, risk tolerance and financial position and consult appropriately registered market intermediaries or financial advisers before making investment or trading decisions.
Any price targets, support or resistance levels mentioned in this article are analytical reference points and may change as market conditions, company fundamentals, economic data and geopolitical developments evolve.
Registration granted by SEBI and certification from NISM in no way guarantee performance of an intermediary or provide any assurance of returns to investors.
Riddhi Siddhi Share Brokers accepts no liability for investment or trading decisions made solely on the basis of this article.