
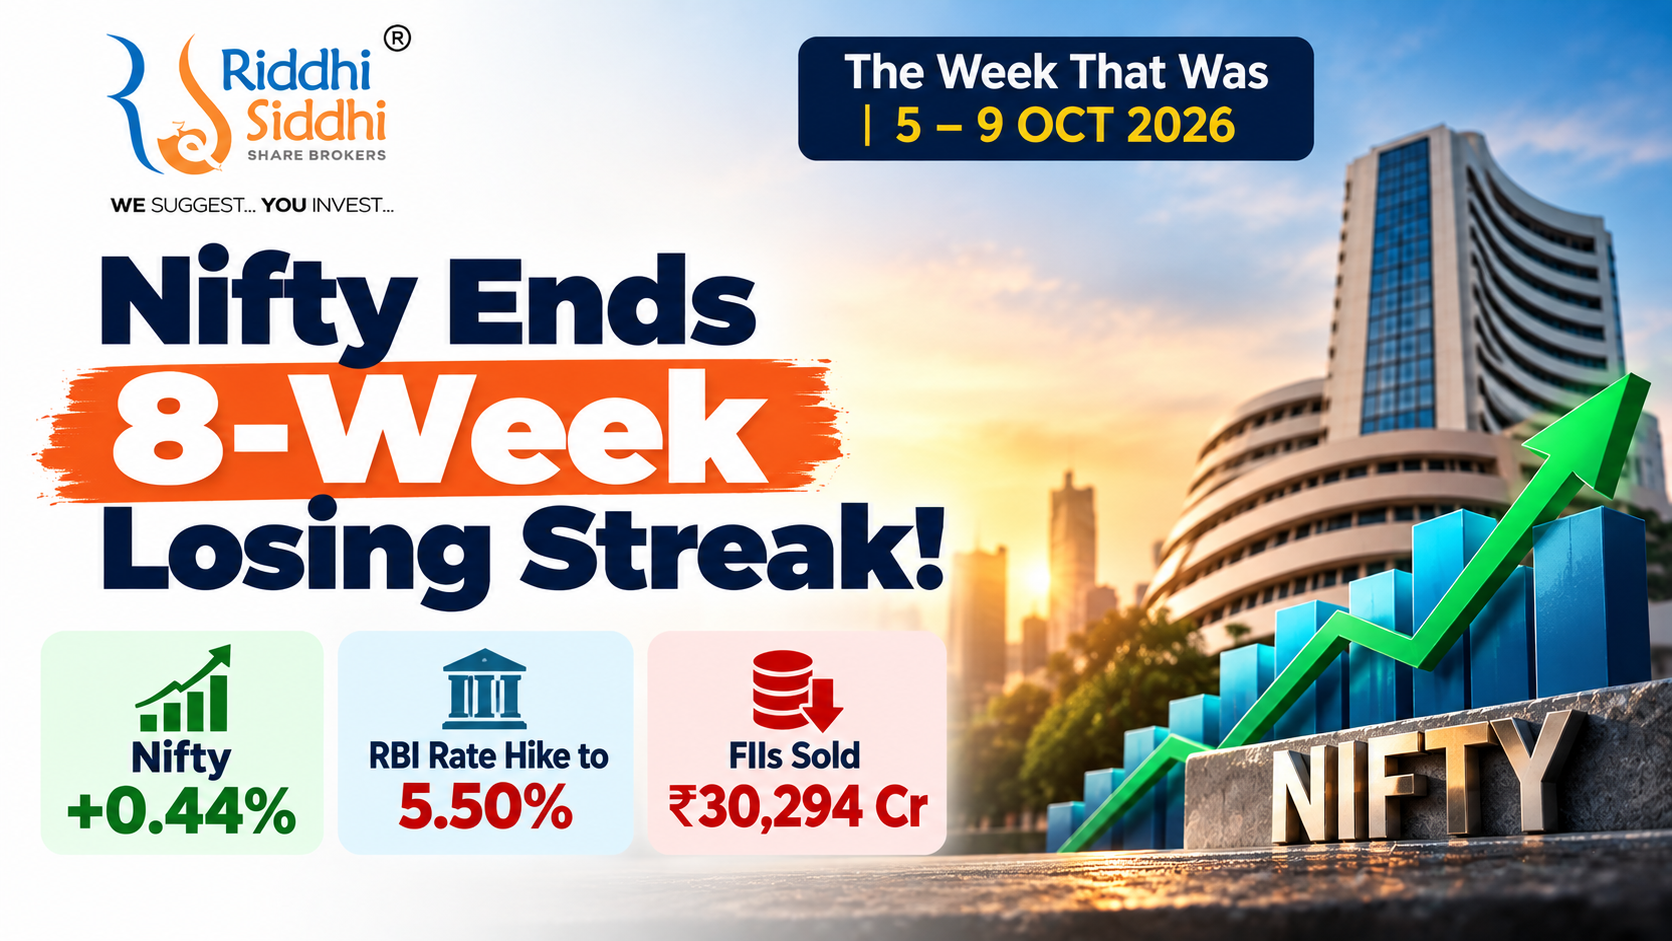
Indian Stock Market Weekly Review | October 5–9, 2026
Published: Saturday, October 10, 2026
By Riddhi Siddhi Share Brokers
Eight consecutive weeks of losses. Nearly ₹30,300 crore of foreign institutional selling in five trading sessions. An unexpected RBI interest-rate hike. Crude oil hovering around $100 per barrel. And a rupee under pressure against the US dollar.
Yet, Indian equity markets finally managed to finish a week in positive territory.
The Nifty 50 closed at 22,520.45 on Friday, October 9, 2026, gaining 98.50 points or 0.44% for the week. The BSE Sensex ended at 72,472.33, recording a weekly gain of 562.63 points or 0.78%.
The recovery ended eight consecutive weeks of declines — the longest such losing streak in approximately 25 years.
But there is something particularly interesting about this recovery.
Nifty gained 288.65 points on Friday alone, yet finished the entire week only 98.50 points higher.
In other words, the market’s positive weekly performance depended heavily on a powerful final-session rebound.
This raises an important question.
Has the Indian stock market finally established a bottom, or is this another relief rally within a broader corrective phase?
In this edition of The Week That Was, Riddhi Siddhi Share Brokers examines the market’s five-day journey, RBI policy, institutional flows, sector rotation, stocks in focus, global developments and the outlook for October 12–16, 2026.
1. Indian Stock Market Weekly Performance: October 5–9, 2026
Indian benchmark indices finished higher, but the recovery was far from uniform.
| Index | October 9 Closing | Weekly Change |
|---|---|---|
| Nifty 50 | 22,520.45 | +0.44% |
| BSE Sensex | 72,472.33 | +0.78% |
| Bank Nifty | 55,256.65 | +0.25% |
| Fin Nifty | 24,968.50 | +0.93% |
Source: Published weekly market reviews and closing-market reports. Percentage figures are rounded.
The Nifty’s 0.44% weekly gain followed eight consecutive weeks of selling pressure that had erased approximately 8.7% of the index’s value.
The Sensex had experienced a similarly difficult period.
Friday’s rebound was therefore important for market sentiment.
However, the relatively modest weekly gains also demonstrate how much selling pressure persisted during the week.
What Made Friday Different?
On October 9:
- Sensex surged 879.09 points, or 1.23%.
- Nifty gained 288.65 points, or 1.30%.
- Nifty IT advanced approximately 3.02%.
- TCS and other technology stocks led the recovery.
- Domestic institutions remained net buyers.
- Easing crude oil prices provided some relief.
The Friday rally helped reverse much of Thursday’s sharp decline.
Nevertheless, a strong closing session is not sufficient evidence that the broader market trend has permanently changed.
2. Nifty’s Five-Day Journey: Optimism, RBI Shock, Panic and Recovery
The week of October 5–9 demonstrated how rapidly market sentiment can change.
| Date | Nifty Closing | Daily Movement |
|---|---|---|
| Monday, October 5 | 22,555.75 | +134 points |
| Tuesday, October 6 | 22,776.10 | +220 points |
| Wednesday, October 7 | 22,603.05 | −173 points |
| Thursday, October 8 | 22,231.80 | −371 points |
| Friday, October 9 | 22,520.45 | +289 points |
Daily movements are rounded to the nearest point.
Monday, October 5: A Positive Beginning
The market opened the week with renewed optimism.
Softer US employment data, some easing in crude oil prices and selective buying in heavyweight stocks helped Nifty recover.
Banking stocks also attracted attention following developments at HDFC Bank.
Nifty closed at 22,555.75.
Tuesday, October 6: Nifty Crosses 22,700
The recovery continued on Tuesday.
Positive global cues and encouraging quarterly business updates from selected companies supported buying interest.
Nifty climbed to 22,776.10.
At this point, the market appeared to be building momentum ahead of the RBI monetary policy announcement.
Wednesday, October 7: RBI Changes the Mood
The RBI increased its repo rate by 25 basis points to 5.50%.
It also changed its policy stance from neutral to calibrated tightening.
The decision forced investors to reassess borrowing costs, inflation risks and the possibility of further monetary tightening.
Nifty declined to 22,603.05.
Thursday, October 8: The Sharpest Sell-Off
Thursday became the week’s most difficult trading session.
Nifty plunged approximately 371 points to 22,231.80.
The Sensex lost 1,045.46 points to close at 71,593.24.
Rising crude prices, foreign selling, elevated US Treasury yields and concerns about tighter liquidity weighed on the market.
Friday, October 9: The Bulls Fight Back
Friday brought a powerful recovery.
TCS’s quarterly results improved sentiment toward technology stocks.
Crude oil eased from elevated levels, while selective short covering and institutional buying supported the broader market.
Nifty recovered to 22,520.45.
Riddhi Siddhi Share Brokers’ weekly observation: The market has demonstrated an ability to rebound sharply, but sustained buying across multiple sessions will be necessary before a more durable recovery can be established.
3. RBI October 2026 Monetary Policy: Repo Rate Rises to 5.50%
The RBI’s October 7 decision was arguably the most important domestic macroeconomic development of the week.
The Monetary Policy Committee increased the policy repo rate by 25 basis points to 5.50%, its first rate hike since February 2023.
The decision was unanimous, while the shift to a calibrated tightening stance was approved by a 4:2 majority.
RBI Monetary Policy Highlights
| Indicator | October 2026 |
|---|---|
| Repo rate | 5.50% |
| Rate increase | 25 basis points |
| Previous repo rate | 5.25% |
| Policy stance | Calibrated tightening |
| FY27 GDP growth projection | 7.10% |
| Previous GDP projection | 6.70% |
The RBI’s decision presents an interesting contrast.
While inflation risks have increased, the central bank has simultaneously upgraded its economic growth outlook.
This suggests that policymakers believe India’s economy has sufficient resilience to withstand some monetary tightening.
Why Did the RBI Raise Rates?
Several developments have complicated the inflation outlook.
Crude oil: Elevated global energy prices can increase transportation, manufacturing and household costs.
Rupee depreciation: A weaker currency raises the domestic cost of imported goods and services.
Global financial conditions: Higher overseas bond yields can influence capital flows, exchange rates and borrowing costs.
Inflation expectations: The RBI must consider whether temporary price pressures could become more persistent.
What Does the Rate Hike Mean for Bank Nifty?
Higher interest rates do not affect every bank in the same way.
Banks with a larger share of floating-rate loans may experience faster loan repricing.
However, deposit costs may also rise as customers seek better returns.
The eventual impact on net interest margins depends on the relative speed of asset and liability repricing.
NBFCs and other businesses dependent on borrowed funds may experience additional funding pressure.
Another RBI Development: Tighter Daily CRR Requirements
The RBI also increased the minimum daily cash reserve maintenance requirement from 90% to 99% of the prescribed CRR, effective from the fortnight beginning October 16.
The average CRR requirement over the maintenance period remains unchanged.
The adjustment reduces the flexibility banks have in maintaining daily reserves and may help align overnight money-market rates more closely with the policy repo rate.
This development matters because the RBI is not relying solely on the headline repo rate to influence monetary conditions.
Riddhi Siddhi Share Brokers previously explored the relationship between liquidity, interest rates and financial markets in RBI Drains Over ₹6 Lakh Crore From Banks: What Excess Liquidity Means for Interest Rates, Bonds & Stocks.
The October policy developments make that earlier discussion particularly relevant.
4. FII vs DII Activity: Foreign Selling Continues, Domestic Institutions Absorb the Pressure
Institutional flows remained one of the defining themes of the week.
Foreign institutional investors sold approximately ₹30,294 crore of Indian equities during October 5–9.
Domestic institutional investors purchased approximately ₹30,313 crore.
Weekly Institutional Flow Scorecard
| Investor Category | Net Cash-Market Activity |
|---|---|
| Foreign Institutional Investors | −₹30,294 crore |
| Domestic Institutional Investors | +₹30,313 crore |
| Difference between net flows | Approximately +₹19 crore |
Figures are rounded from provisional cash-market data. FII/DII cash-market flows should not be interpreted as a complete accounting of all investment activity.
The contrast is significant.
Despite heavy foreign selling, domestic institutional buying helped absorb much of the pressure.
Why Are Foreign Investors Selling?
Foreign outflows may reflect several overlapping factors.
Higher US Treasury Yields
Elevated US bond yields can make dollar-denominated assets more attractive relative to emerging-market equities.
Currency Risk
A depreciating rupee can reduce dollar-based returns for foreign investors.
Global Geopolitical Uncertainty
Oil-supply disruptions and geopolitical tensions can increase risk aversion.
Valuation Concerns
Foreign investors may reassess Indian equity valuations relative to earnings expectations and opportunities in other markets.
The distinction between foreign participation in India’s primary and secondary markets is also important.
In September, foreign investors sold heavily in the secondary market while continuing to invest in selected IPOs.
Riddhi Siddhi Share Brokers examined this divergence in FPIs Sold ₹45,537 Crore of Indian Stocks—but Put ₹9,676 Crore Into IPOs: What Are Foreign Investors Seeing?.
Has FII Selling Peaked?
It is too early to conclude.
A slowdown in foreign selling would be constructive, particularly if accompanied by stabilising currency conditions and improving corporate earnings.
However, one or two sessions of reduced selling would not necessarily establish a lasting reversal in institutional flows.
5. Sector Performance: FMCG, Banks and IT Show Relative Strength
The week’s sector performance revealed a market where investors remained selective.
Some sectors recovered, while others continued facing selling pressure.
Relatively Stronger Sectors
| Sector | Approximate Weekly Change |
|---|---|
| Nifty Capital Markets | +2% |
| Nifty FMCG | +2% |
| Nifty PSU Bank | +2% |
| Nifty Private Bank | +2% |
| Nifty IT | +1% |
Changes are rounded sector-performance figures from published weekly market reviews.
FMCG stocks showed resilience as investors assessed consumer demand and pricing power.
Banking stocks benefited from selective buying, although the RBI’s tighter policy stance creates a more complex outlook.
IT stocks recovered after TCS’s quarterly results.
Sectors Facing Pressure
| Sector | Approximate Weekly Change |
|---|---|
| Nifty Realty | −3% |
| Nifty Metal | −3% |
| Nifty Auto | −2% |
| Nifty Defence | −1.5% |
Real estate remained sensitive to financing costs and interest-rate expectations.
Metal stocks faced pressure from global economic uncertainty and commodity-market developments.
Automobile companies remained exposed to financing costs, consumer demand and input-price volatility.
What Does Sector Rotation Tell Us?
A market recovery becomes more convincing when gains extend beyond a small number of heavyweight stocks.
Investors should monitor whether:
- More sectors begin participating in rallies.
- Advancing stocks consistently outnumber declining stocks.
- Mid-cap and small-cap indices improve alongside benchmarks.
- Earnings growth supports price appreciation.
A rising Nifty accompanied by weak broader-market participation may indicate a relatively narrow recovery.
6. Stocks in the Spotlight: Trent Leads, Adani Enterprises Struggles
Stock-specific developments remained important even as the broader market experienced substantial volatility.
Nifty’s Notable Weekly Gainers
| Company | Approximate Weekly Change |
|---|---|
| Trent | +13.11% |
| Kotak Mahindra Bank | +6.01% |
| HDFC Life Insurance | +4.83% |
| BSE | +3.38% |
| Axis Bank | +3.02% |
Nifty’s Notable Weekly Losers
| Company | Approximate Weekly Change |
|---|---|
| Adani Enterprises | −8.02% |
| JSW Steel | −5.45% |
| Bharat Electronics | −4.34% |
| Hindalco Industries | −4.05% |
| Titan Company | −3.71% |
Returns follow a published weekly market comparison. Individual percentages may vary with the price basis and index universe used.
Trent: Consumer Demand Supports the Stock
Trent was among the week’s strongest performers.
The company’s quarterly business update indicated standalone revenue growth of approximately 23% year-on-year.
Its retail expansion and sales momentum attracted investor attention.
However, investors should distinguish revenue growth from profitability.
Store productivity, margins, inventory management and working capital remain important considerations.
TCS: Earnings Help Restore Confidence in IT
TCS reported quarterly net profit of approximately ₹13,884 crore, up around 4% sequentially.
The results helped support Friday’s rally in technology stocks.
However, the broader IT outlook will continue to depend on client spending, operating margins, deal execution and demand for AI-related services.
Adani Enterprises: Selling Pressure Persists
Adani Enterprises was among the notable weekly decliners.
The stock’s weakness highlighted the importance of company-specific developments and market sentiment.
Investors should rely on confirmed corporate announcements rather than speculation when assessing such movements.
Titan: Jewellery Growth Remains Under Scrutiny
Titan also finished the week lower.
Investors continued assessing jewellery-business growth, consumer demand and the implications of elevated precious-metal prices.
The market reaction demonstrates that even established consumer businesses can experience price pressure when growth expectations or valuations are reassessed.
7. Global Markets, Crude Oil and the Rupee: Why International Developments Matter
Indian equities do not operate independently of global financial conditions.
The week demonstrated how international developments can influence domestic market sentiment through several channels.
Crude Oil Remains a Major Inflation Risk
Brent crude remained elevated, trading around $102 per barrel toward Friday.
India’s dependence on imported crude makes energy prices particularly important.
Higher oil prices can affect:
- India’s import bill.
- Inflation expectations.
- Transportation and manufacturing costs.
- Corporate operating margins.
- Demand for US dollars.
- Monetary policy expectations.
Riddhi Siddhi Share Brokers previously explained these connections in Crude Oil Above $100, Rupee Above ₹95: What It Means for Nifty, Inflation & Indian Stocks.
US Treasury Yields and FII Flows
Higher US bond yields can affect global capital allocation.
As yields increase, some investors may find US fixed-income assets more attractive relative to emerging-market equities.
Higher discount rates can also influence equity valuations.
For readers seeking a deeper explanation, our earlier article US Bond Yields Hit 5%: Why Rising US Treasury Yields Matter for Nifty & Indian Stocks examines the transmission of US yield movements into Indian financial markets.
Rupee Weakness Creates Uneven Sector Effects
A weaker rupee can increase import costs for energy-intensive and import-dependent businesses.
Some exporters may benefit from dollar-denominated revenues, although hedging arrangements and foreign expenses influence the final outcome.
The impact is therefore not uniformly positive or negative.
Currency volatility also matters for foreign investors evaluating returns in their home currencies.
8. October 10 Weekend Development: RBI Moves to Ease Pressure on the Rupee
An important development occurred after Friday’s equity-market close.
On Saturday, October 10, the RBI announced additional foreign-exchange measures intended to address pressure on the rupee.
The measures included a special dollar-supply window for major public-sector oil marketing companies and tighter requirements for certain foreign-exchange derivative transactions.
Why Is This Important?
Oil marketing companies require substantial dollar liquidity for crude imports.
Providing a dedicated dollar-supply arrangement can help reduce concentrated demand in the foreign-exchange market.
Additional derivative-market controls may also discourage certain speculative positions.
What Could Happen on Monday?
Investors will monitor whether the measures help stabilise the rupee and reduce currency-market volatility.
However, the actual effect will depend on implementation, global dollar movements, crude prices and foreign investment flows.
RBI intervention should not be interpreted as a guarantee that the rupee will strengthen or that equity markets will rise.
For Riddhi Siddhi Share Brokers’ readers, the development is particularly relevant because currency stability has become closely linked to market confidence.
9. Nifty Technical Outlook: Key Reference Levels for October 12–16
Nifty ended the week at 22,520.45.
Although the index recovered strongly on Friday, it remains important to assess whether the rebound can extend beyond immediate resistance areas.
Nifty Levels to Monitor
| Level | Technical Interpretation |
|---|---|
| 22,700–22,800 | Immediate resistance zone |
| 23,000 | Psychological resistance |
| 23,070 | Higher recovery-confirmation reference |
| 22,200 | Important lower reference area |
| 22,180 | Breakdown reference |
| 21,740–21,800 | Deeper downside reference zone |
These are indicative chart-reference zones based on recent market analysis, not guaranteed support, resistance or personalised trading recommendations.
Bullish Scenario
A sustained move above 22,700–22,800, accompanied by improving market breadth and stronger participation, could suggest that the recovery is gaining momentum.
A move beyond 23,000–23,070 would provide additional evidence of improvement in the short-term price structure.
Bearish Scenario
If Nifty fails to sustain the recovery and moves decisively below 22,180–22,200, lower reference zones may attract attention.
Consolidation Scenario
The index may remain range-bound while investors evaluate inflation data, earnings, crude oil, currency developments and institutional flows.
What About Derivatives Indicators?
Option-chain positioning, put-call ratios, open interest and volatility indicators can provide additional information about market positioning.
However, PCR, maximum call/put open interest and options build-up should be evaluated using current, timestamped exchange data.
Static figures can become outdated quickly during volatile sessions.
The same caution applies to 21-day, 50-day and 200-day moving averages, which require a clearly specified calculation methodology and observation date.
Readers interested in derivatives-market structure can also explore Nifty Swings 850 Points in Closing Auction: Why F&O Traders Need to Understand CAS.
10. The Week Ahead: October 12–16, 2026
The next trading week could be influenced by domestic inflation releases, corporate earnings, institutional activity and international developments.
Domestic Economic Events
| Date | Economic Indicator | Market Relevance |
|---|---|---|
| October 12 | September CPI inflation | Consumer inflation and RBI policy expectations |
| October 14 | September WPI inflation | Wholesale prices and corporate input costs |
Release schedules should be reconfirmed against official government calendars.
Q2 FY27 Earnings Season
The earnings season will gather momentum, with technology, consumer and financial businesses attracting attention.
HCL Technologies, Wipro, Tech Mahindra and other major companies are among those investors will monitor during the developing results season.
Official stock-exchange announcements should be used to confirm each company’s reporting date.
Five Major Indicators for the Coming Week
1. Rupee movement: Whether the RBI’s latest measures reduce currency-market pressure.
2. FII and DII activity: Whether foreign selling moderates and domestic institutional buying remains supportive.
3. Crude oil: Whether prices stabilise or geopolitical developments create fresh supply concerns.
4. Inflation: Whether consumer and wholesale inflation reinforce expectations of further monetary tightening.
5. Corporate earnings: Whether quarterly results and management guidance support current valuations.
The Market’s Most Important Test
A sustainable recovery will require more than one strong Friday rally.
It would be more encouraging to see a combination of improving market breadth, stable institutional flows, supportive earnings and reduced global uncertainty.
Until then, market participants should distinguish between improving sentiment and a confirmed change in the underlying trend.
11. What Can Investors Learn From This Week?
The week offers three important lessons.
A Relief Rally Is Not Necessarily a Trend Reversal
Markets can recover sharply after prolonged selling because traders cover bearish positions or investors respond to temporarily improving conditions.
A more durable recovery generally requires confirmation from multiple indicators.
Domestic and Global Factors Must Be Evaluated Together
Indian corporate earnings and domestic economic growth matter.
But global interest rates, crude oil, geopolitical risks and currency movements can materially influence market valuations and institutional flows.
Risk Management Matters More During Volatility
Sharp daily movements can create significant risks, particularly for leveraged derivatives positions.
Investors and traders should understand the possibility of losses, the limitations of technical indicators and the importance of aligning market participation with their financial circumstances.
Riddhi Siddhi Share Brokers previously examined the risks of derivatives participation in Nearly 88% of Individual F&O Traders Lost Money: What SEBI’s FY25–FY26 Study Should Teach Every Trader.
For long-term investors, market corrections should also be viewed in historical context. Our article What 30 Years of Nifty History Teaches Investors About Market Crashes and Long-Term Investing explores why uncertainty is a recurring feature of financial markets.
12. Assisted Trading and Trade Execution Support by Riddhi Siddhi Share Brokers
Market volatility can create operational challenges for individuals who cannot continuously monitor price movements and trading activity.
Riddhi Siddhi Share Brokers provides Assisted Trading and Trade Execution Support for eligible clients in equity delivery and permitted derivatives segments.
The service is intended to support authorised trade execution and related operational activities through the client’s own trading account, subject to applicable broker procedures and regulatory requirements.
It does not constitute investment advisory services or discretionary portfolio management.
Connect With Riddhi Siddhi Share Brokers
Learn more about Assisted Trading and Trade Execution Support.
Website: https://www.riddhisiddhisharebrokers.com
Call / WhatsApp: +91 91379 69859
Message +91 99875 53455 to request access to our exclusive WhatsApp community for daily prices, opportunities and market updates.
You can also connect with Riddhi Siddhi Share Brokers to understand the eligibility criteria, service arrangements and operational support available for Assisted Trading.
Frequently Asked Questions
1. Why did Nifty end its eight-week losing streak?
Nifty recovered on Friday, October 9, supported by technology stocks, selective buying and improved sentiment. The strong final session helped the index finish the week 0.44% higher.
2. What was Nifty’s closing level on October 9, 2026?
Nifty closed at 22,520.45, gaining 288.65 points during Friday’s session.
3. How much did Sensex gain during October 5–9?
Sensex gained 562.63 points, or approximately 0.78%, for the week.
4. What was the RBI repo rate after the October 2026 MPC meeting?
The RBI increased the policy repo rate by 25 basis points to 5.50% on October 7, 2026.
5. How much did FIIs sell during the week?
Reported net foreign institutional selling in the cash equity market was approximately ₹30,294 crore during October 5–9.
6. Which sectors performed relatively well?
FMCG, banking, capital markets and IT were among the relatively stronger sectors, while realty, metals and automobiles faced pressure.
7. Is the Nifty downtrend over?
The eight-week losing streak has ended, but that alone does not confirm the end of the broader corrective trend. Market breadth, earnings, institutional flows and price behaviour remain important.
8. What are the important Nifty levels for October 12–16?
Indicative reference areas include resistance around 22,700–22,800 and 23,000, with lower reference zones around 22,180–22,200. These are not guaranteed trading levels.
9. Why is the rupee important for the stock market?
Currency movements influence import costs, inflation, foreign investment returns and the profitability of businesses with international revenues or expenses.
10. Does Riddhi Siddhi Share Brokers provide investment advisory services?
No. Riddhi Siddhi Share Brokers is an NSE & BSE registered Authorised Person of a leading broker and does not provide investment advisory services.
Conclusion: The Losing Streak Is Over, but the Real Test Begins Now
The week of October 5–9, 2026, marked an important change for Indian equities.
Nifty finally ended eight consecutive weeks of losses. Sensex recovered. Technology stocks led a strong Friday rally, and domestic institutional investors continued absorbing substantial foreign selling.
But the challenges have not disappeared.
The RBI has moved toward tighter monetary policy. Crude oil remains elevated. US bond yields continue to influence global capital allocation, and rupee stability has become increasingly important.
The RBI’s fresh October 10 currency measures add another variable to the week ahead.
The market has shown that buyers can return. The unanswered question is whether that buying can continue when inflation data, quarterly earnings and global risks are put to the test.
At Riddhi Siddhi Share Brokers, our focus is on helping readers understand market developments, assess risks and approach market participation with informed expectations.
Riddhi Siddhi Share Brokers — We Suggest… You Invest.
Disclaimer and Regulatory Disclosure
This article is published by Riddhi Siddhi Share Brokers solely for educational, learning and informational purposes. It does not constitute investment advice, personalised investment research, a recommendation to buy or sell securities, or a guarantee of future market performance.
Riddhi Siddhi Share Brokers is an NSE & BSE registered Authorised Person of a leading broker and does not provide investment advisory services.
Investments and trading activities in securities markets are subject to market risks. Equity derivatives and leveraged products involve substantial risk and may not be suitable for all investors. Past performance is not indicative of future returns.
All market data, third-party statistics, technical reference levels and economic forecasts are subject to revision, differences in reporting methodology and subsequent developments.
Readers should verify important information through official exchange, regulator and company disclosures.
Investors should evaluate their financial objectives, risk tolerance and financial circumstances and consult a SEBI-registered investment adviser where appropriate.
Assisted Trading and Trade Execution Support are operational services and do not guarantee returns or protection against losses.